 QUANTT
- Complex and ambiguous reports are hard to interpret
- Prices take longer to react
- Our edge is interpretation, not speed
Hirshleifer, Lim & Teoh (2009) · You & Zhang (2009)
A long/short U.S. equity strategy, beta-neutral by design. We own the highest-quality large companies and short the ones whose 8-K filings read worst inside a language model's brain.
Companies must file an 8-K within four business days of a material event. The text is long, and investors underreact to soft, negative news, so the price keeps moving for weeks.
Item 1.01 Entry into a Material Definitive Agreement.
On May 12, 2026, Eos Energy Enterprises Inc. entered into a binding term sheet with … an affiliate of Cerberus Capital Management, L.P., which provides for … the formation of a joint venture …
The investment by the Company in the JV Company is expected to be financed by a rights offering to holders of Eos Common Shares.
In the event of a liquidation of the JV Company, distributions will be made as follows: (a) first to CCM Frontier until it has received a return of its invested capital …
Our model scored it in the bottom 2%. We went short. The filing describes a joint venture funded by a rights offering to existing shareholders, with the partner paid back first in a liquidation.
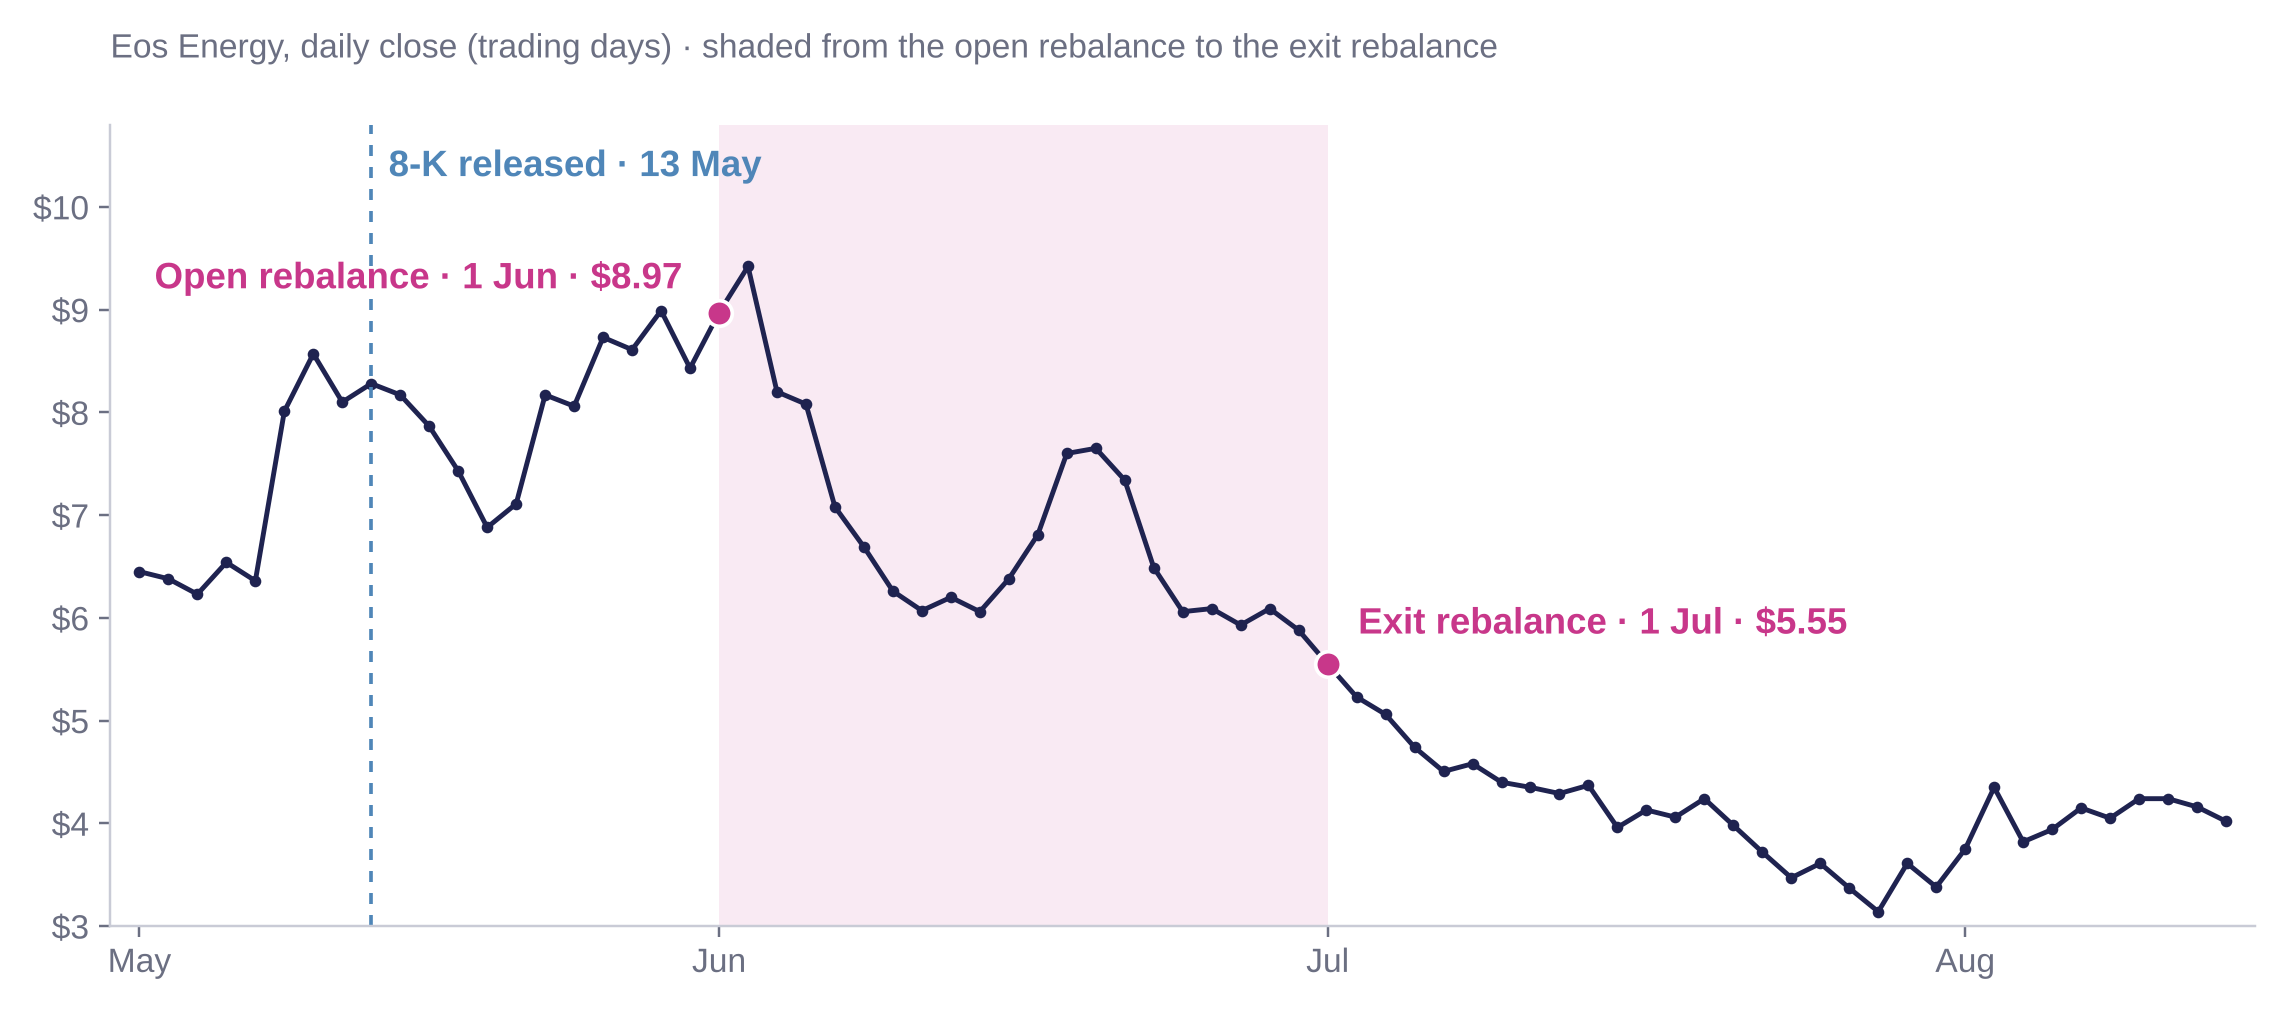
Out-of-sample backtest, January 2021 to August 2026, US$1bn start, after modelled Interactive Brokers commissions, market impact and borrow costs. All 13 competition rules met on every trading day.
Our fundamental hypothesis. Three bodies of research explain why it pays, and why our edge is interpretation, not speed.
Hirshleifer, Lim & Teoh (2009) · You & Zhang (2009)
Miller (1977)
Asness, Frazzini & Pedersen (2019) · Cohen & Frazzini (2008)
Short names with negatively interpreted 8-Ks. Long high-quality firms. Beta-neutral.
Why not just ask a chatbot whether a filing is good news? Because that squeezes a whole filing into one word. Instead we record what lights up inside the model while it reads.
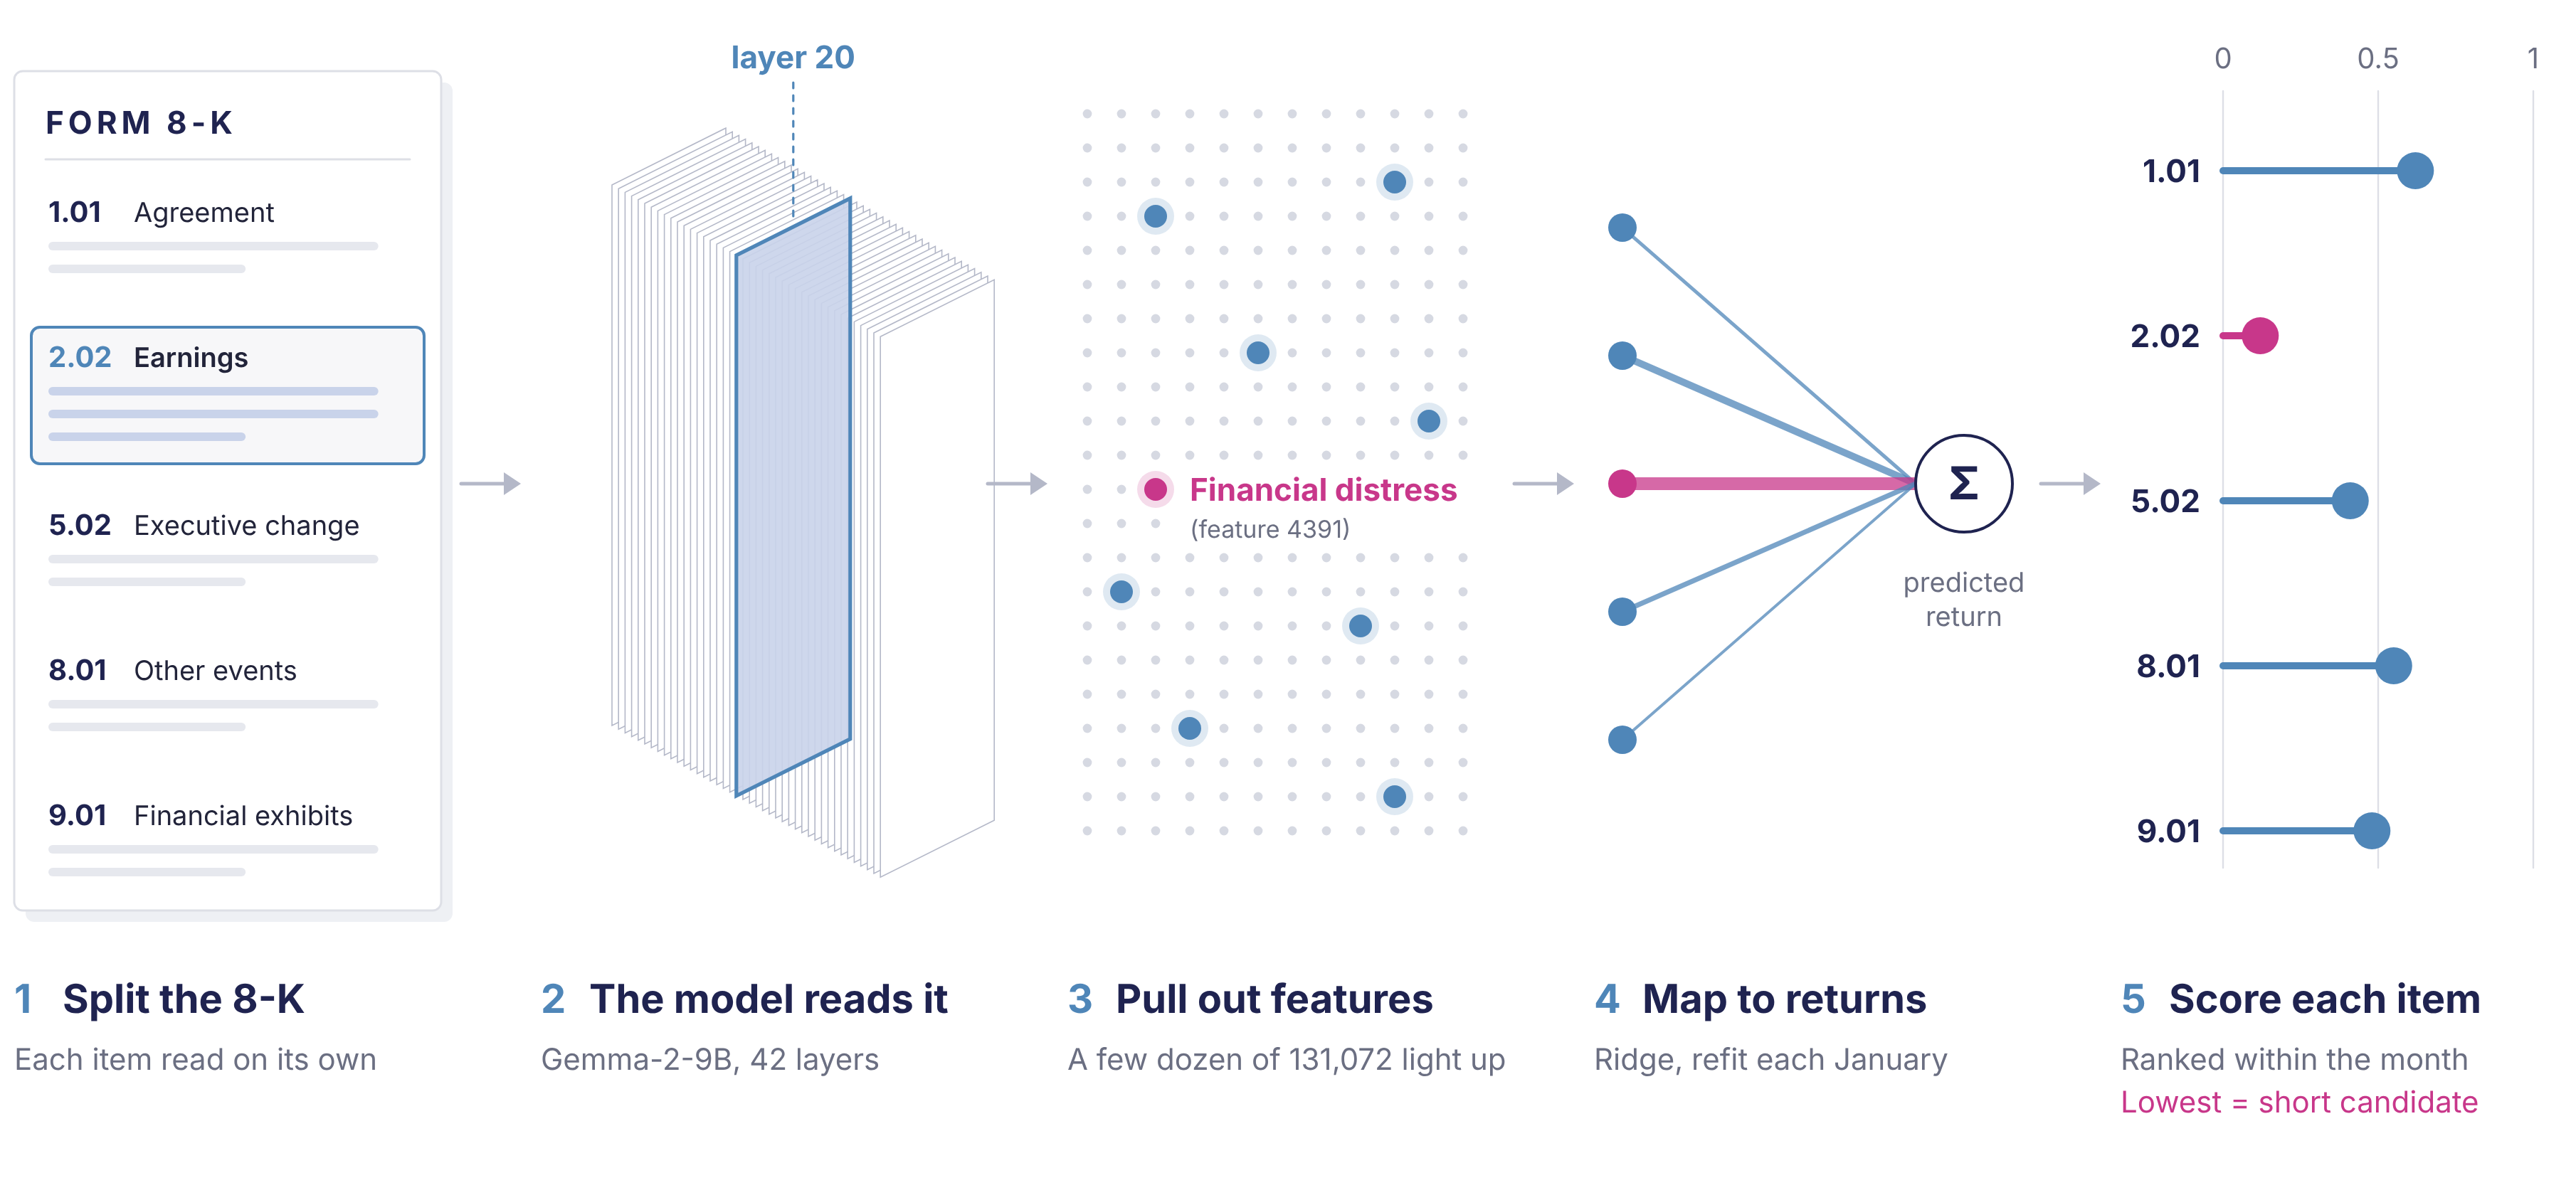
Explainable shorts. Every feature has a published description, so a portfolio manager can see why a name is on the short list: distress, dilution and drug-trial risk.
A patience trade. Our picks keep earning for three months after each monthly rebalance: on average 0.07% above the hurdle on day 1, 1.2% by day 21 and 3.3% by day 63 (t = 7.0). Dense filings are read slowly, so we can trade slowly.
No memory of prices. The model never sees a ticker, a price, a date after the filing, or a question about the future. It reads one section of text, once.
Two lanes, rebuilt every month: the short leg from 8-K filings, the long leg from fundamentals and demand signals. Both feed one optimiser. Follow the walkthrough, or click any stage.
Information known through day t forms the book at the close of day t+1.
Rank on fundamentals first, then let three alternative signals validate and boost them, then aggregate into our 125 long picks.
147 fundamentals combined with shrunk maximum-Sharpe weights (Kozak, Nagel and Santosh, 2020), refit each January on past data and ranked within each sector, so the longs are not a sector bet.
The four ranks are added in equal parts (as in Asness, Frazzini and Pedersen, 2019). We buy the best 125 of the 500 largest U.S. companies, weighted by the square root of size, no name above 5%.
Better where we chose it. At the same 12% volatility, adding card spending and the supply chain lifted the 2019–20 validation information ratio from 1.15 to 1.33. Out of sample it held at about 1.0, with lower beta.
Why we run at 8%. The 12% version realised 10.2% volatility and 14.4% over its worst six months. We cut the target to 8%: the out-of-sample information ratio falls to 0.82, but risk sits well inside the rule and at half the market's.
Four filters take every company we are allowed to short down to 125 that read badly, trade easily and are cheap to borrow.
Analysts talk to management and revise slowly, and prices are slow to follow their revisions (Chan, Jegadeesh and Lakonishok, 1996). We never short a stock that analysts are upgrading.
People sell shares for many reasons but buy for one: they think the stock is cheap (Lakonishok and Lee, 2001). We never short a stock its insiders are buying.
When fewer funds hold a stock, the pessimists are leaving and returns tend to be lower afterwards (Chen, Hong and Stein, 2002). We do not short stocks funds are piling into.
125 long
125 short
Bigger firm, bigger long. Worse score, bigger short. Leg sizes set so the target beta is zero.
≤ 1% ADV a day
End-of-month signals and rebalance; execute at the next day's close (T+1). 89% of a month's rebalance is done by day 15.
Leg sizes are set on each stock's 60-month beta, and the optimiser holds the target book's beta at zero every month. Realised daily beta is 0.13, because longs fill in a day and shorts over a week or more.
The rules allow 12–14% and say lower is better. The optimiser caps expected volatility at 8%, about half the market's. Realised volatility was 8.2%.
An independent validator re-checks all 13 rules at every close: 249 to 357 names, gross at most 189%, no name above 5%, every short at least $500m, 10 or more sectors.
| Net exposure, average (range) | +39% (+24% to +50%) |
| Gross exposure, average (max) | 159% (189%) |
| Names held, average (range) | 295 (249–357) |
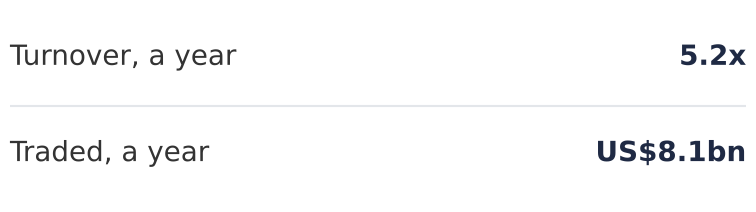
| Turnover, one-way, a year | 4.5× |
| Average holding period | 144 trading days |
| Costs, % of capital a year | 1.1% trading + 0.4% borrow |
Every number below is out of sample, after all modelled costs, at a US$1bn fund size where those costs bind.
0.83 monthly, against the T-bill + 4% hurdle the rules set.
S&P 500: 16.6%.
S&P 500: −24.5%.
| Before costs | After costs | T-bill + 4% | S&P 500 | |
|---|---|---|---|---|
| Return a year (compound) | 16.3% | 14.6% | 7.5% | 15.1% |
| Information ratio vs. hurdle | 1.00 | 0.82 | – | – |
| Sharpe ratio | 1.49 | 1.31 | – | 0.74 |
| Sortino ratio | – | 1.98 | – | – |
| Alpha vs. S&P 500, a year (s.e.) | 10.7% (3.4) | 9.2% (3.4) | – | – |
| Beta to S&P 500 (s.e.) | 0.13 (0.01) | 0.13 (0.01) | – | 1.00 |
| Volatility | 8.2% | 8.2% | – | 16.6% |
| Worst fall from a peak | −5.8% | −5.9% | – | −24.5% |
| Months ahead of the hurdle | – | 62% | – | 59% |
2022 shows the point. Rate rises hit speculative stocks. The longs lost 3.9% of capital, but the junk we shorted re-priced and earned 19.3%.
Steady by design. The book beat the hurdle in 5 of 6 calendar years. It does not try to win a strong bull year like 2023; it earns a steady return with a fraction of the risk.
Costs are fully charged. About 1.1% of capital a year for trading, including market impact, and 0.4% for borrow, at a US$1bn fund size. With the rules' flat borrow fee, the information ratio is 0.63.
We uploaded the daily holdings to Arcana (portfolio 34693623, January 2021 to August 2026). Each view is shown exactly as Arcana reports it.
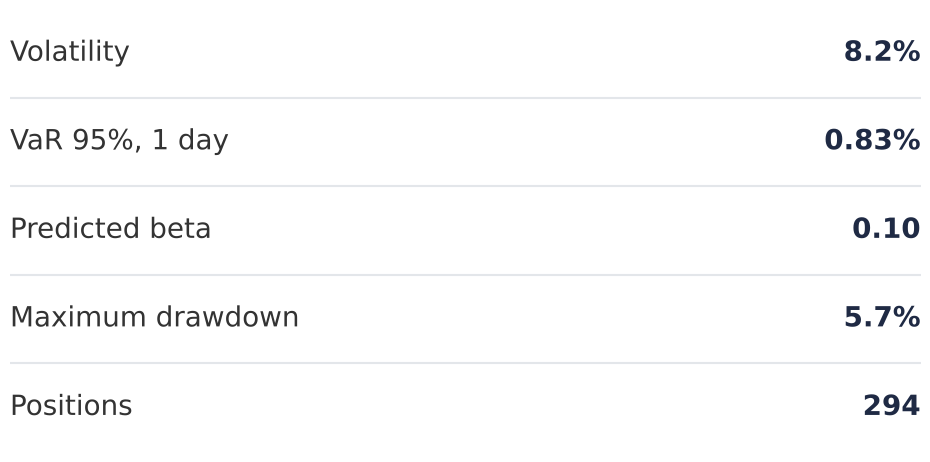
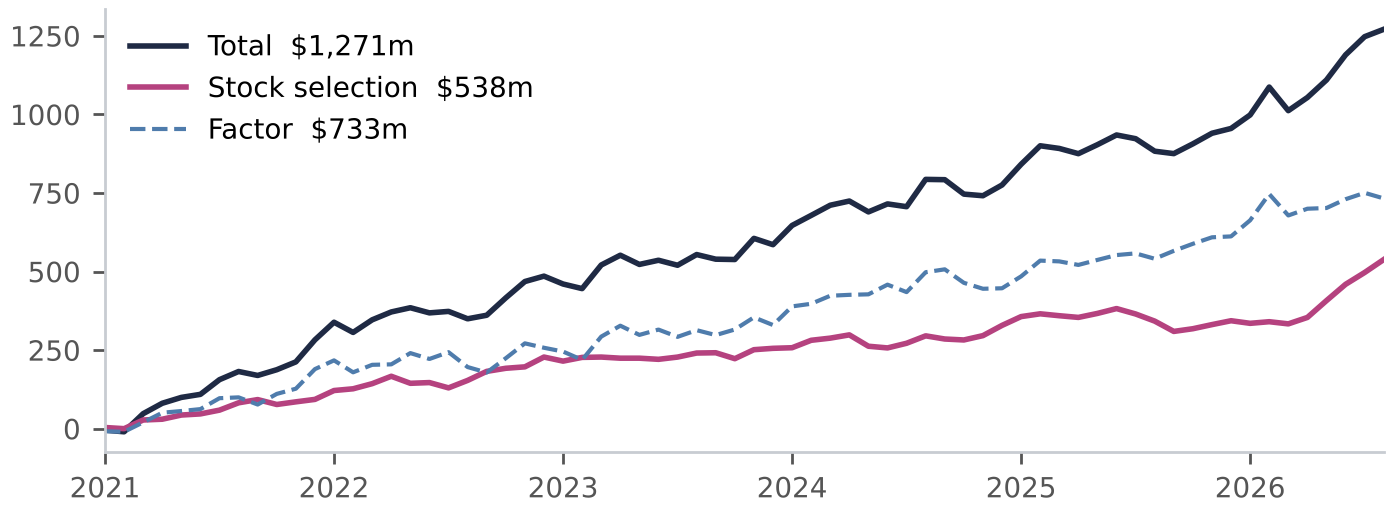
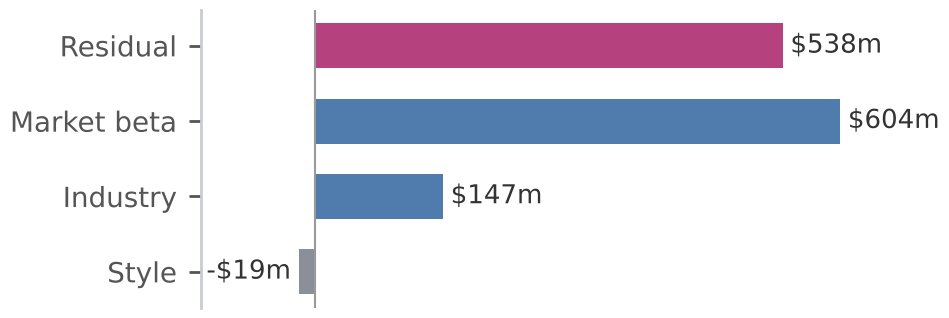
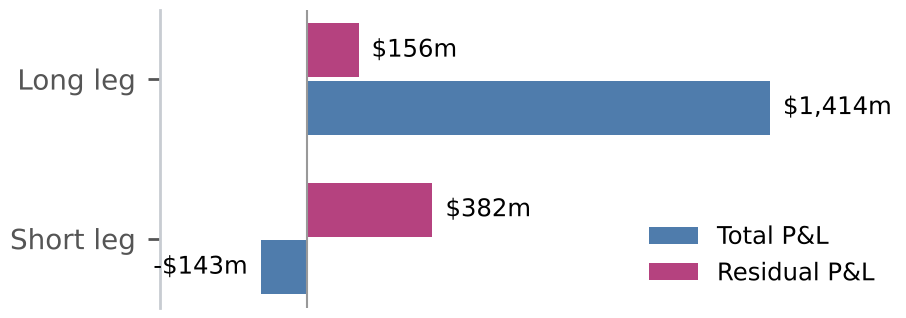
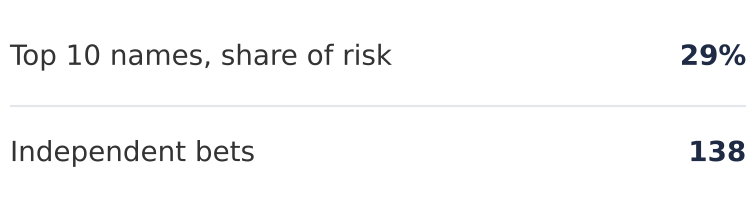
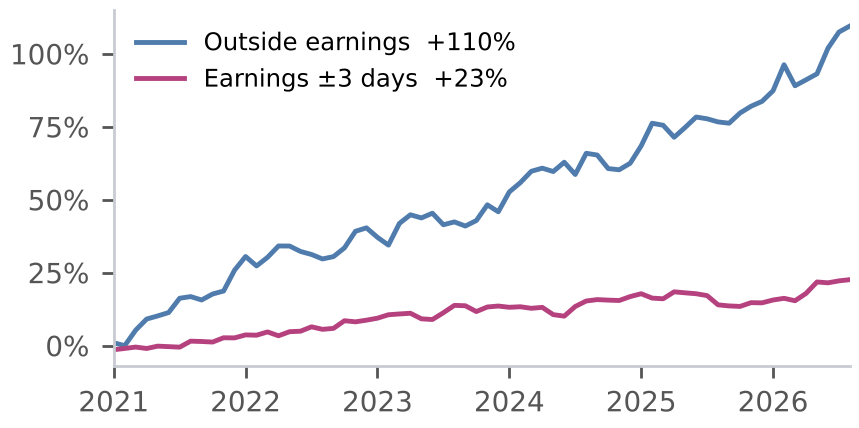
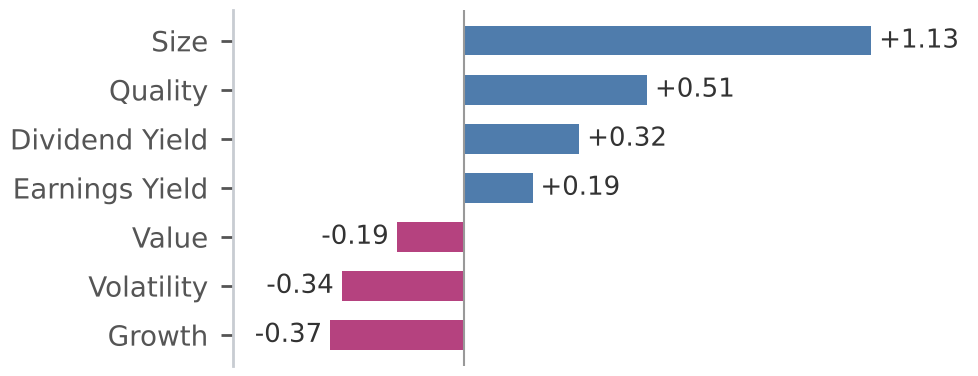
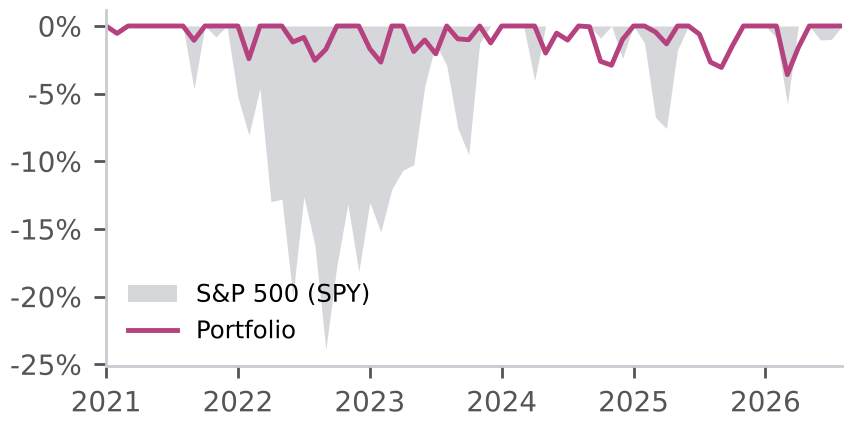
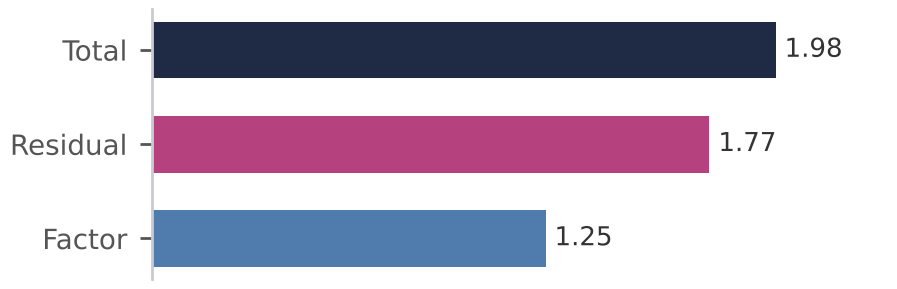
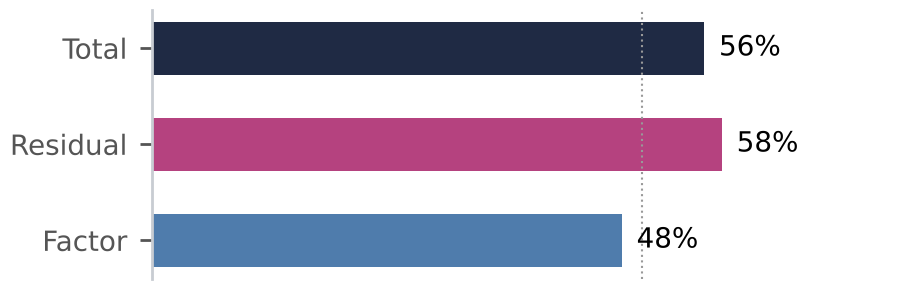
The validator checked all 419,274 holdings rows: none was traded before the close of the day after its information became public.
After the Fama-French five factors and momentum, 5.2% a year of alpha remains (t = 2.1), and those factors explain under half of daily variance.
All thirteen competition rules pass at every close of the out-of-sample period.
You should never invest in something you do not understand. This short film follows a filing from data to dollars.
QUANTT is the Queen's University Algorithmic Network & Trading Team. Our FIAM 2026 team spans Queen's, Waterloo and Laurier.